Context
While investigating the latency of an API, I noticed that different Azure services were reporting different execution times for the same request. The caller reported a total duration of 851ms, APIM reported 845ms, and Application Insights showed that APIM waited 837.6ms for the Logic App to respond. However, the Logic App runtime view appeared to show only about 400ms of execution time.
The request flows through APIM to a Logic App (Consumption), which performs some in-memory processing before invoking an HTTP endpoint as part of the workflow.
This article walks through the investigation and shows how AzureDiagnostics can be used to account for almost every millisecond of the reported latency.By the end, we’ll reconcile the reported latency to within 3.5 ms.
Analysis
The durations logged were -
Calling UI logs report it took 851ms to complete the request
APIM reports (ApiManagementGatewayLogs) it took 845 ms to complete. Total Time: 845 ms | Backend Time: 837 ms | Client Time: 5 ms.
This means, between the UI and APIM there is a 6 ms difference, (851ms –845ms) which can largely be attributed to network transit. APIM spent about 5 ms preparing and returning the response to the caller. So, Backend Time + Client Time = ~ total time (there is a small 3ms difference). This is exactly what Application Insights also records - 845ms
As per the Application Insights, 837.6ms is the APIM backend duration — the elapsed time between APIM forwarding the request to the Logic App endpoint and APIM receiving the HTTP response from that endpoint
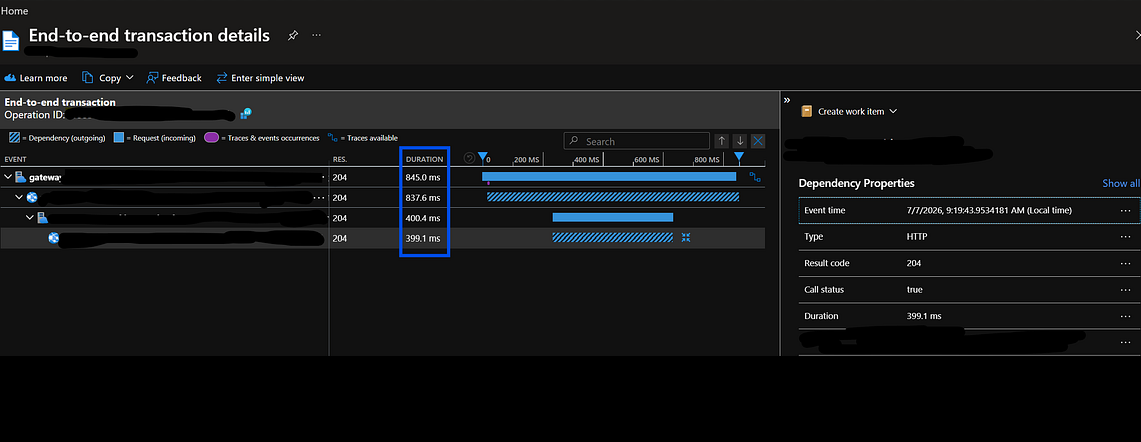
The strange part was that while Application Insights reported 837.6ms, the Logic App runtime log showed just about 400ms.
**Note ** - Ignore the parallel steps in purple box because the Logic App returns the response and does not wait for these steps. All calculations are excluding these steps
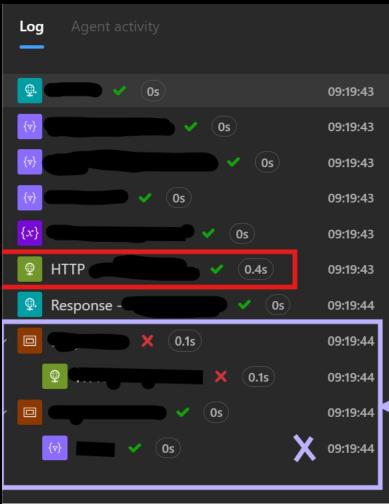
At first glance, it appears that the Logic App spent only about 400ms executing because several actions are shown as 0s in the runtime view. Then why is Application Insights reporting 837.6ms?
Unaccounted duration - 437.6ms (837.6ms as per AppInsights - 400ms taken by backend)
So, I pulled up the logs from AzureDiagnostics table in the associated Log Analytics Workspace. It gave an entirely different picture. All the steps that were reported as 0s in Logic App runtime page were actually consuming measurable milliseconds. As shown below.
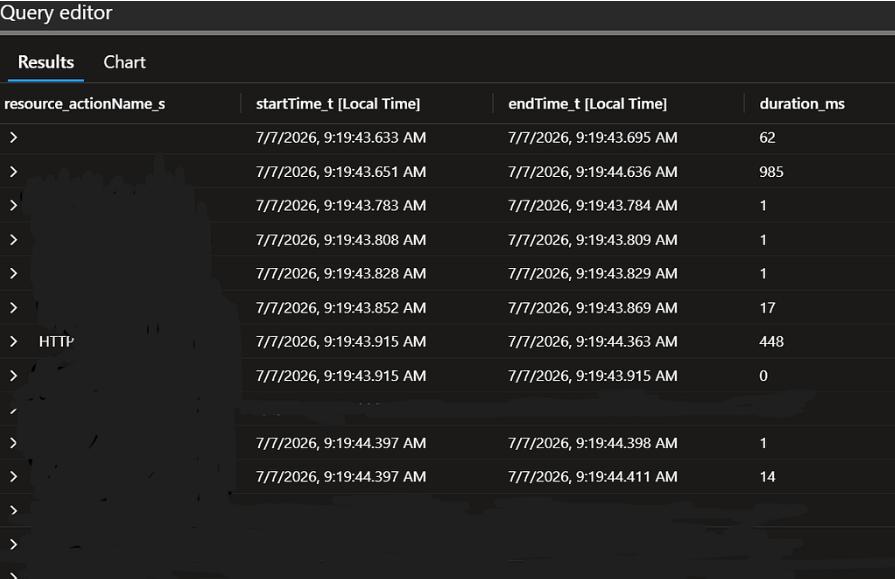
- The first row is the trigger of the Logic App
- The second row tells you how long the logic app workflow ran. You may be wondering why it shows as 985ms - that’s because this workflow has a parallel branching within that still runs after the response is sent back to the caller after ~837.6ms. From that point till 985ms (~147.4ms) was consumed by the parallel branch and is not relevant for this discussion. I have removed the parallel unrelated actions in the screenshot.
- So, lesson 1 - always look at AzureDiagnostics for real latency numbers.
Adding all those durations came up to 545ms. This is the total time taken by ALL the actions within the Logic App.
Revised Unaccounted duration is 292.6ms (837.6ms, total duration reported in AppInsights - 545ms)
Gap between actions within Logic App
After some analysis, I realized that there is a gap between when the APIM calls the Logic App and when the Logic App’s trigger actually runs. In addition to that, there are gaps between the different action end time and start time. I always assumed that if Action N ended at T ms then Action N+1 would start somewhere around ~ T+1ms. This was not the case. There were considerable gaps between when a parent action ends and its child action starts.
For example, look at the difference between 4th row end time (ends 43.8097323) and 5th row start time (starts 43.8285386) - it is 18.806ms. If you add up all these differences, it is coming up to 233.94ms in my case. ~234ms accounts for most of the unaccounted 292.6ms (refer to end of previous paragraph).
Lesson 2 - The workflow may incur wait time after completing one action and before starting the next action.
My hypothesis is that this effect is more noticeable in the Consumption tier because it runs on shared multi-tenant infrastructure.
Revised Unaccounted duration - 58.6ms
The final piece of the puzzle
Now I have 58.6ms unaccounted for. As per the logs, APIM called Logic App at 2026–07–06T23:49:43.5784182 and Logic App Manual trigger invoked at 2026–07–06T23:49:43.633478
So, the call from APIM to Logic App took 55.06ms to dispatch, adding to the overall duration. Since we know 55.06 was towards the dispatch the total unaccounted time is 58.6ms - 55.06ms = 3.54ms
Final unaccounted duration - 3.54ms
Latency breakdown
APIM backend duration (App Insights) - 837.6 ms
Sum of Logic App action durations - 545.0 ms
Inter-action scheduling gaps - 233.9 ms
APIM → trigger dispatch gap - 55.1 ms
Residual runtime variance - 3.5 ms
Summary
UI reported duration: 851ms; Application Insights reports time taken for the APIM to receive the response from Logic App was 837.6ms
A -> Total duration taken by Logic App as reported in Application Insights is 837.6ms
B -> Total duration for all the tasks (excluding parallel path), as per Log Analytics is 545ms
C -> Gap between the end of parent action and start of child in the logic app, as per Log Analytics is 234ms
Although we set the sequence of actions in Logic App, the logs show measurable scheduling gaps between actions. In Consumption tier, these gaps may be influenced by the shared multi-tenant runtime and workflow orchestration overhead.
D -> Dispatch gap = 43.633478 − 43.5784182 = 0.0550598s = 55.06ms
APIM called Logic App: 2026–07–06T23:49:43.5784182
Logic App Manual trigger invoked: 2026–07–06T23:49:43.633478
Unaccounted time = A - (B + C + D) = 837.6 - (545 + 234 + 55.06) = 3.54ms
Key Observations-
The total workflow duration is not simply the sum of action durations. Logic Apps may introduce scheduling gaps between actions, and these gaps contribute to the end-to-end latency experienced by callers.
AzureDiagnostics is the source of truth for millisecond-level Logic App action timing. The Logic App designer view can round actions to 0s, hiding meaningful execution time and scheduling gaps between actions.
If you’re troubleshooting Logic App latency, don’t rely solely on the Logic App runtime view. Correlating APIM telemetry with AzureDiagnostics provides a much more accurate picture of where time is actually being spent.
Hope this helps!